NIFTY 50 Index: India’s Beacon of Economic Performance
Introduction
Indices play an important role in providing investors with insights into the performance of specific segments of the economy in the ever-changing landscape of financial markets. The NIFTY 50 Index stands out as a true barometer of India’s economic vitality and market prowess.
The NIFTY 50 Index is more than just a stock index; it reflects India’s economic aspirations, growth trajectory, and global competitiveness.
What is the NIFTY 50 Index?
The NIFTY 50 Index, commonly referred to as NIFTY, is the flagship stock market index of the National Stock Exchange of India (NSE). It represents the performance of the equity market by tracking the 50 largest and most liquid stocks across various sectors listed on the NSE. NIFTY is an abbreviation for the National Stock Exchange Fifty.
Composition of NIFTY 50 Index
The NIFTY 50 Index, like many other stock market indices, is constructed and maintained through a well-defined process to ensure that it accurately reflects the performance of the Indian equity market. Here’s an overview of how the index is constructed and maintained:
Selection of Constituent Stocks:
- The process begins with the selection of 50 constituent stocks that will make up the NIFTY 50 Index.
- Eligible stocks are typically chosen based on factors like market capitalization, liquidity, and sector representation.
- Stocks with larger market capitalizations and higher liquidity are more likely to be included.
- Sectoral diversity is also considered to ensure that the index represents a broad range of industries in the Indian economy.
Calculation of Free Float Market Capitalization:
- The free-float market capitalization of each constituent stock is calculated. Free-float market capitalization is the total market value of a company’s outstanding shares that are available for trading by the public.
- It excludes shares held by promoters, founders, and strategic investors, that are not freely tradable in the market.
Determination of Stock Weights:
- The weight of each constituent stock in the NIFTY 50 Index is determined based on its free-float market capitalization.
- The index gives more weight to stocks with larger market capitalizations.
- This means that the performance of larger companies has a more significant impact on the index.
Regular Rebalancing:
- The NIFTY 50 Index undergoes periodic rebalancing to ensure that it accurately represents the current market conditions.
- Rebalancing typically occurs semi-annually or as needed to account for changes in stock prices, market capitalizations, and sectoral weightings.
- New companies that meet the criteria may be added to the index, while companies that no longer meet the requirements may be removed.
Maintenance of the Divisor:
- The NIFTY 50 Index has a divisor that is used to maintain continuity in the index’s value over time.
- Changes in the composition of the index and stock prices can affect the divisor.
- To account for these changes, the divisor is adjusted periodically to ensure that the index’s value remains consistent.
Corporate Actions:
- Corporate actions, such as stock splits, mergers, or rights issues, can impact the composition and calculation of the NIFTY 50 Index.
- Special adjustments are made to account for such corporate actions to maintain the index’s accuracy.
Sectoral and Industry Classification:
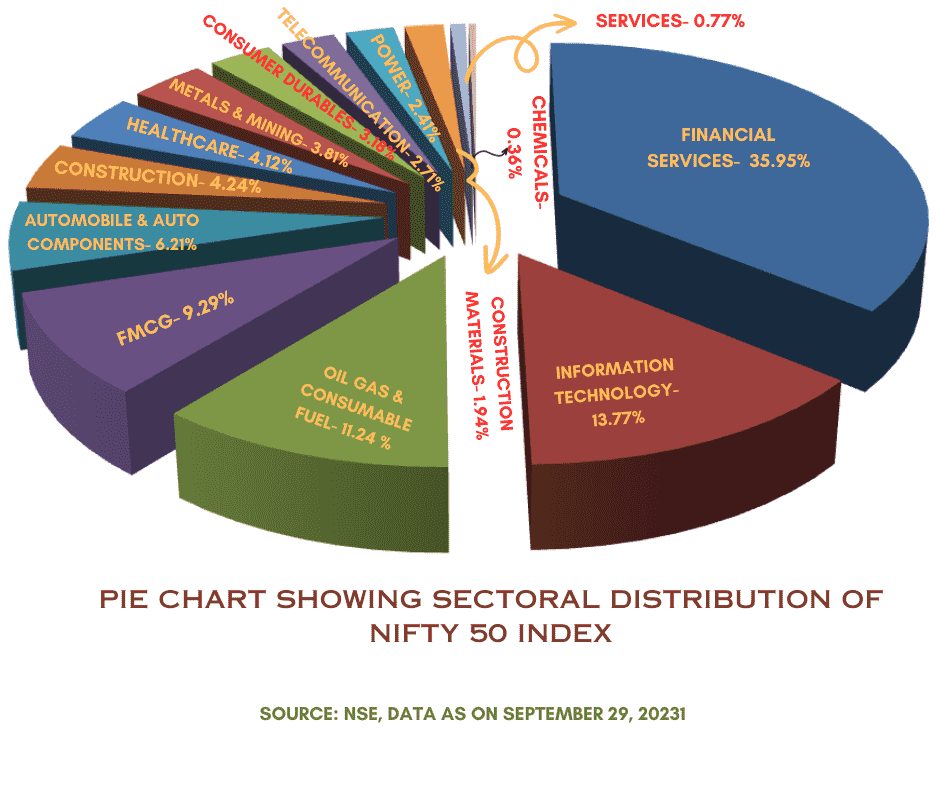
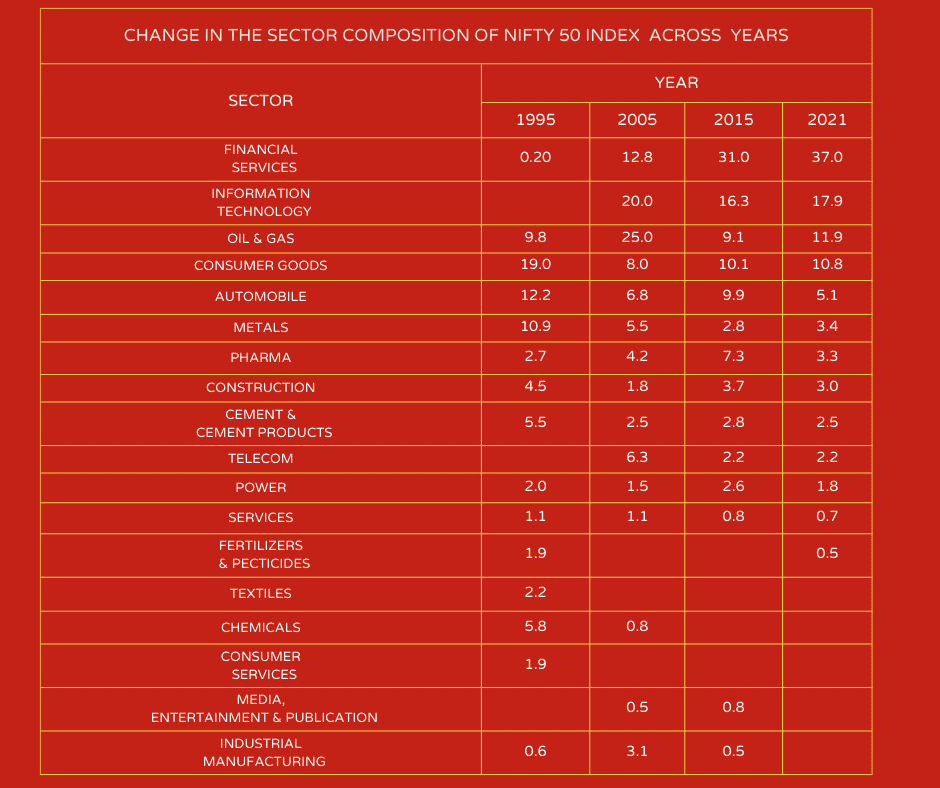
- The NIFTY 50 Index’s constituents are categorized into different sectors and industries.
- Sector classification is important to understand the composition of the index and its exposure to various segments of the economy.
How NIFTY 50 Index is Calculated?
The NIFTY 50 index is a prominent benchmark index on the National Stock Exchange (NSE) of India, comprising the top 50 companies listed on the exchange. It is a widely followed indicator of the Indian stock market’s performance and is calculated using a methodology that involves float adjustment and market capitalization.
The calculation process for the NIFTY 50 index consists of three essential steps:
- Calculation of Market Capitalization (Mcap): Mcap represents the total value of a company’s shares held by investors in the market. To calculate Mcap, you multiply the number of shares outstanding by the current market price of the stock.
- Adjustment for Investable Weight Factor (IWF): The Investable Weight Factor is a crucial factor in the NIFTY 50 calculation. It accounts for shares that are genuinely available for public trading, excluding those held by company promoters, government entities, and shares allocated to employees. The Free-Float Market Capitalization is calculated by multiplying Mcap by the IWF.
- Weighted Calculation: Each stock’s Free Float Market Cap is then multiplied by the weight assigned to that specific stock. The weights reflect the stock’s significance in the index and are usually based on factors like market capitalization and liquidity.
The NIFTY 50 index’s base period is November 3, 1995. To calculate the index value, the following formula is employed:
Index Value = (Current Market Cap / Base Market Capital) x 1000
Here’s a breakdown of the variables in the formula:
Current Market Cap: This represents the weighted market capitalization calculated for the index at the present time.
Base Market Capital: This signifies the weighted market capitalization of all 50 index companies during the base period.
1000: This figure serves as the reference value for the NIFTY 50 index during the base date.
To illustrate this calculation method, consider a simplified example with only two companies, Company A and Company B, in the NIFTY 50. Below are their market capitalizations and assigned weights:
| Company | Market Capitalization | Weight |
| A | ₹10 Crores | 60% |
| B | ₹ 6 Crores | 40% |
To calculate the NIFTY 50’s value, you follow these steps:
- Calculate the current market cap:
Current Market Cap = (₹10 Crores x 60%) + (₹6 Crores x 40%) = ₹8.4 Crores
- Calculate the base market capitalization:
Base Market Capital = (₹10 Crores + ₹6 Crores) = ₹16 Crores
- Determine the NIFTY 50 Index Value:
Index Value = (₹8.4 Crores / ₹16 Crores) x 1000 = 525
Role of NIFTY 50 Index in the Indian Market
The NIFTY 50 plays a significant and multifaceted role in the Indian financial markets, serving as a critical benchmark and indicator of the nation’s economic health and stock market performance. Its influence extends to various aspects of the Indian financial landscape:
Benchmark for Performance: The NIFTY 50 is the primary benchmark index for the Indian stock market. It provides a reference point against which the performance of individual stocks, mutual funds, and other investment portfolios is measured. Investors and fund managers often compare their returns to the NIFTY 50’s performance.
Indicator of Market Trends: The index’s movements are closely monitored by investors, analysts, and policymakers to gauge the direction of the Indian equity market. It is seen as a barometer of market sentiment and is used to identify broader market trends.
Investment and Portfolio Management: Many investment products, including index funds and exchange-traded funds (ETFs), are designed to replicate the performance of the NIFTY 50. Investors can use these products to gain exposure to the entire index or specific sectors within it. For portfolio managers, the NIFTY 50 serves as a guide for asset allocation and investment decisions.
Risk Management: The index is a valuable tool for assessing the risk and volatility of the Indian stock market. Investors use its historical volatility and performance patterns to manage risk and make informed investment choices.
Sectoral Analysis: The sectoral distribution within the NIFTY 50 provides insights into the relative strength and performance of different sectors of the Indian economy. Investors use this data to identify investment opportunities and sectoral trends.
Global Recognition: The NIFTY 50’s international recognition and use as a benchmark make it attractive to foreign investors looking to invest in Indian equities. It contributes to India’s integration into the global financial system.
Economic Indicator: Movements in the NIFTY 50 can be indicative of broader economic trends in India. It can serve as an early warning system for economic shifts, as stock markets often respond to changes in economic conditions.
Liquidity and Trading: Stocks included in the NIFTY 50 tend to have higher liquidity because they are widely tracked and held by institutional investors. This liquidity can attract more trading activity and investment capital to these stocks.
Market Sentiment: The NIFTY 50’s performance can influence investor sentiment. Positive moves in the index can boost confidence, while significant declines may lead to cautious or bearish sentiment.
Policy Decisions: Policymakers and regulators may consider the NIFTY 50’s performance and market conditions when making decisions related to economic and financial policies.
Historical Performance of NIFTY 50 Index
Analyzing the historical data of the NIFTY 50 Index from 2001 to 2022, we can observe several significant points and trends:
- Long-Term Growth: Over this 22-year period, the NIFTY 50 Index has shown substantial long-term growth. The index has risen from around 1,059 points in 2001 to approximately 18,105 points in 2022, representing a remarkable upward trajectory.
- Volatility: The data reveals periods of high volatility, with substantial annual highs and lows. For example, in 2008, the index saw a sharp decline due to the global financial crisis, reaching a low of 2,959 points. This volatility is indicative of the challenges and uncertainties faced by the Indian stock market during various economic events.
- Recovery and Resilience: The NIFTY 50 Index has demonstrated its ability to recover from significant setbacks, such as the recovery from the 2008 financial crisis. It rebounded strongly, reaching new highs in subsequent years.
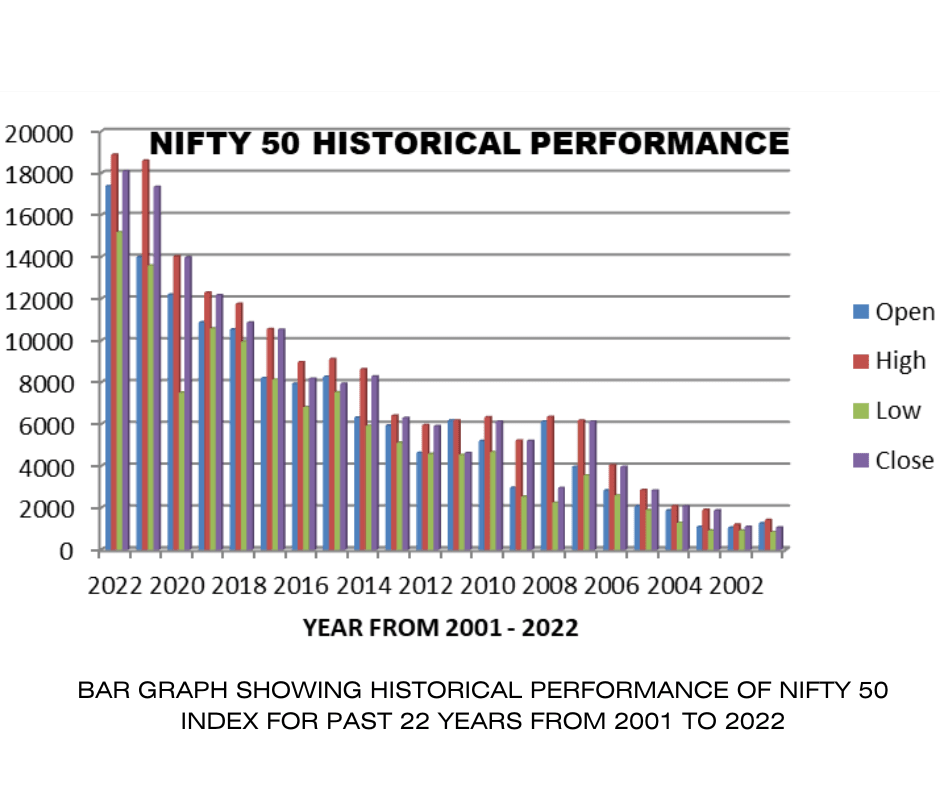
- Historical Highs: The index reached its all-time high in 2022, closing at 18,105.3 points. This suggests that, despite challenges and downturns, the Indian stock market has performed well in recent years.
- Strong Growth in the 2010s: The decade from 2010 to 2020 witnessed substantial growth in the NIFTY 50 Index, with the index more than doubling during this period. This decade was marked by economic development and increased investor confidence.
- Economic Downturn in 2020: The year 2020 saw a significant downturn, with the index dropping to 7,511.1 points during the height of the COVID-19 pandemic. However, the market quickly recovered and reached new highs in subsequent years.
- Cyclical Nature: The data illustrates the cyclical nature of the stock market, with periods of boom followed by corrections. This cyclicality is a common feature of stock markets worldwide.
- Impact of Global Events: Global economic events, such as the financial crisis in 2008 and the COVID-19 pandemic in 2020, have had a substantial impact on the NIFTY 50 Index. These events highlight the interconnectedness of the global financial markets.
- Steep Growth in Recent Years: The NIFTY 50 Index has experienced steep growth in the last couple of years, reflecting positive sentiment in the Indian economy and financial markets.
- Relative Stability: In recent years, the index has shown relative stability and resilience, even during uncertain times. This suggests that the Indian stock market has matured and is attracting more stable and long-term investments.
Funds Launched by NIFTY 50 Index
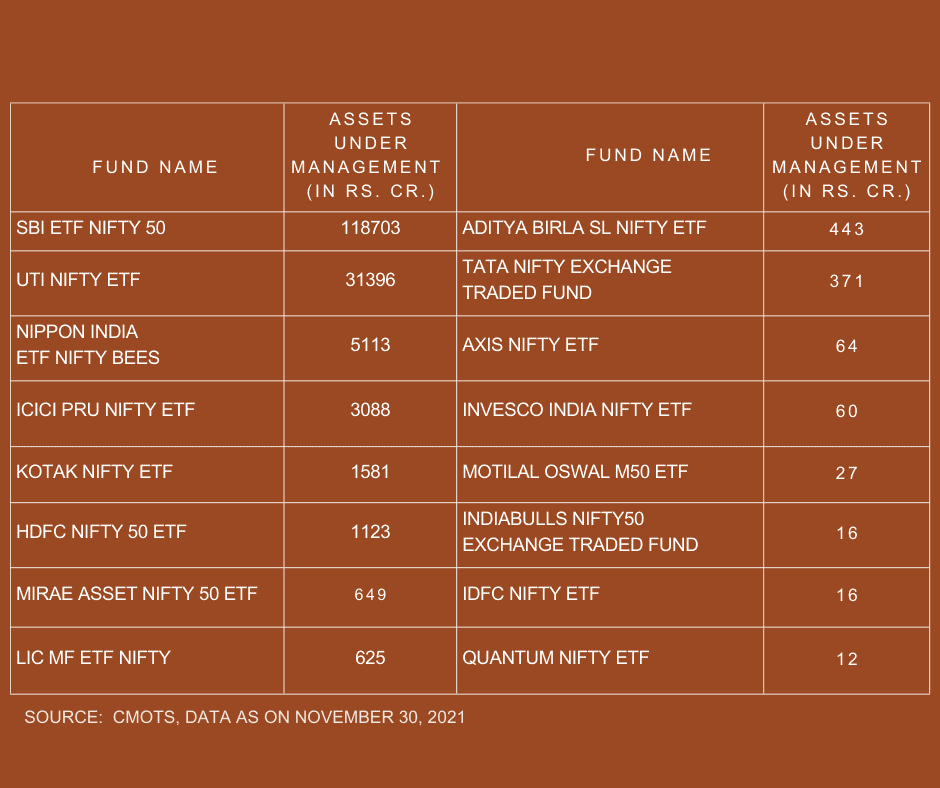
Several financial products and funds have been launched that are linked to or track the performance of the NIFTY 50 Index. These funds are often called Exchange-Traded Funds (ETFs) or Index Mutual Funds. Here are some examples of funds that are launched with a focus on the NIFTY 50 Index:
(A) NIFTY 50 ETF’s
(B) NIFTY 50 INDEX FUNDS
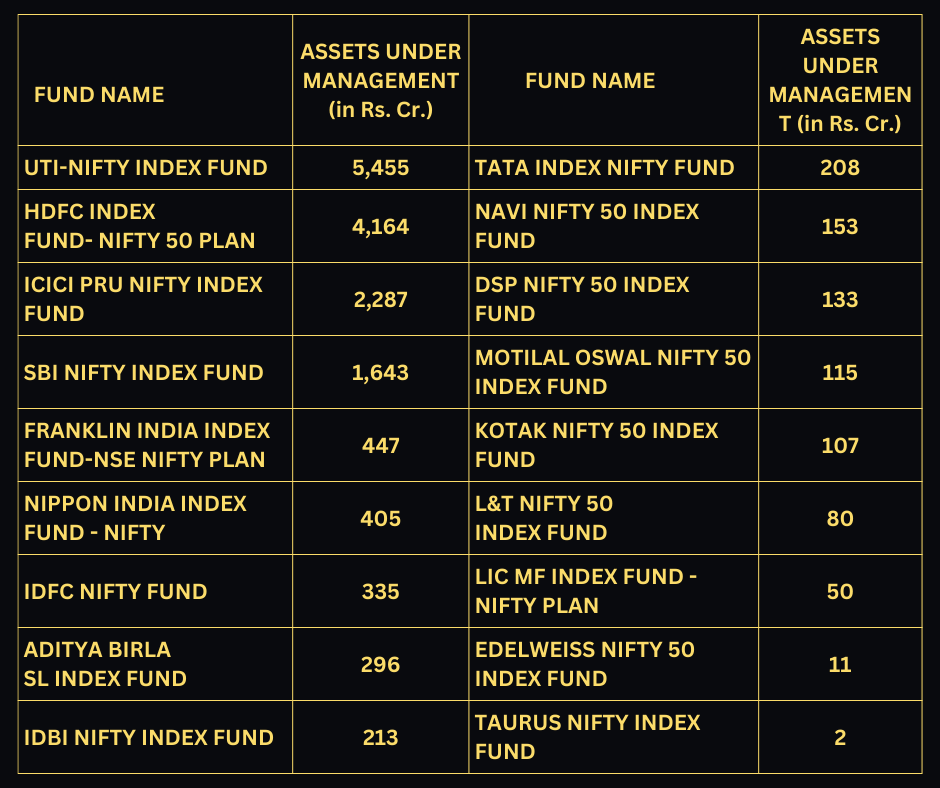
SOURCE: CMOTS, DATA AS ON 30 NOVEMBER, 2021


