Global Insurance Industry: Sizing Up the Indian Growth Story
Introduction
The insurance industry stands as a robust guardian against uncertainties, a shield that offers financial protection and security in the face of unforeseen events. Within this expansive domain lies a world of intricate market dynamics, ever-evolving trends, and regional peculiarities that collectively shape the industry’s global landscape.
The global insurance sector, valued in trillions, represents a multifaceted network of protection, risk management, and financial fortification. It is a landscape characterized by a diverse array of life, non-life, and health insurance products, all serving the crucial purpose of providing individuals and businesses with a safety net against life’s uncertainties.
Market Size: Insurance Industry
According to Business Research Company, the worldwide insurance market increased at an 8.7% compound annual growth rate from $5946.74 billion in 2022 to $6466.23 billion in 2023. The Russia-Ukraine War hampered worldwide economic recovery from the COVID-19 pandemic, at least in the immediate term. The conflict between these two countries resulted in economic sanctions against many countries, a jump in commodity prices, and supply chain disruptions, generating inflation across commodities and services and hurting practically every market globally.
The global insurance industry is predicted to expand to $8603.8 billion by 2027, at a CAGR of 7.4%.
The rapid development of internet adoption, as well as the heightened risks associated with using the internet for crucial transactions, is driving the demand for cyber insurance. Cyber insurance includes insurance-based risks as well as risks associated with information technology infrastructure. It also covers property thefts, business interruption, software and data loss, cyber extortion, network failure liability, cybercrime, and physical asset damage.
According to the National Health Authority of India, an Indian government agency, there are 1.18 billion mobile connections, 600 million smartphones, and 700 million internet users in India in 2021, with the number increasing by 25 million every quarter. As a result, the insurance market is driven by the rapid development of internet use and the rising risks connected with the use of the internet.
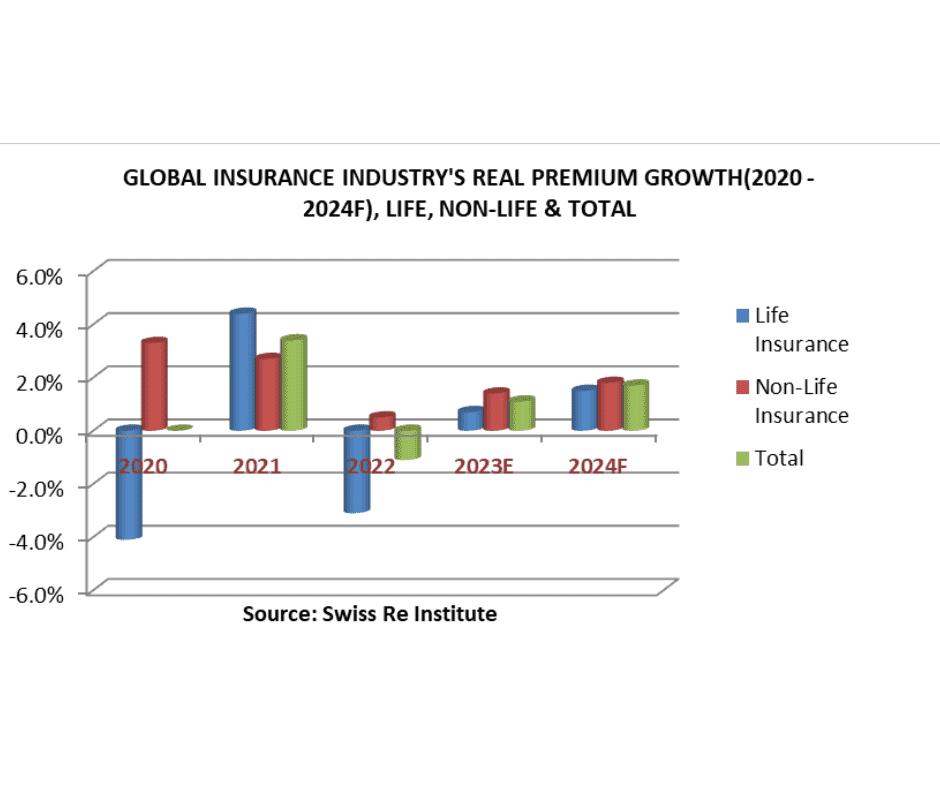
According to the Swiss Re Institute, following a 1.1% fall in 2022, global insurance premium volumes (life and non-life) will go up by 1.1% in 2023 and 1.7% in 2024 in real terms (both below the 10-year trend of 2.6%).
Global Market Ranking
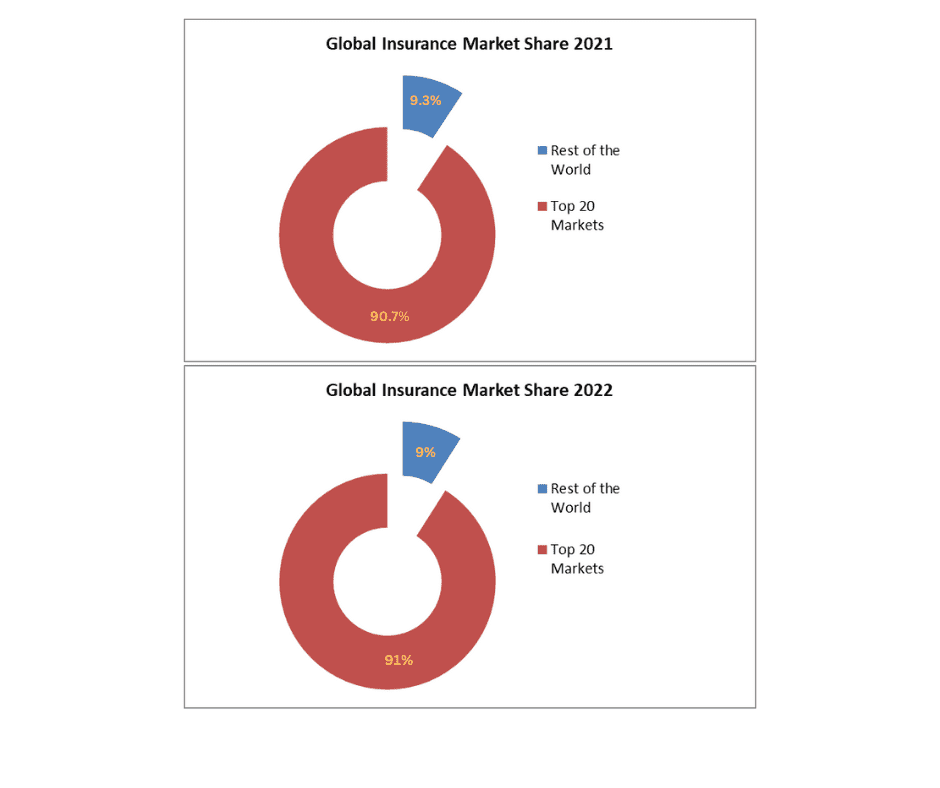
In 2023, worldwide premium volumes will reach a record high of USD 7.1 trillion. In terms of premium volume, the United States would be by far the largest market in 2022. China, the United Kingdom, and Japan followed. The four countries accounted for 62 percent of global premiums. The top 20 nations’ market share remained at 90% in 2021, with China, Japan, South Korea, India, Taiwan, and Hong Kong, the six Asian markets, accounting for 23% of the market share (according to the Swiss Re Institute).
| WORLD’S 20 LARGEST INSURANCE MARKETS BY NOMINAL PREMIUM VOLUMES (2022 VS 2021) | ||||||
| Rank | Country/ Market | Total Premium Volume (USD Billion) | Total Premium Volume (USD Billion) | Total Premium Volume (USD Billion) | Global Market Share | Global Market Share |
| 2022 | 2021 | % Change | 2022 | 2021 | ||
| 1 | US | 2960 | 2725 | 8.6% | 43.7% | 40.3% |
| 2 | China | 698 | 696 | 0.2% | 10.3% | 10.3% |
| 3 | UK | 363 | 374 | -2.8% | 5.4% | 5.5% |
| 4 | Japan | 338 | 398 | -15.1% | 5% | 5.9% |
| 5 | France | 261 | 293 | -10.7% | 3.9% | 4.3% |
| 6 | Germany | 242 | 272 | -11.3% | 3.6% | 4.0% |
| 7 | South Korea | 183 | 193 | -5.3% | 2.7% | 2.9% |
| 8 | Canada | 171 | 166 | 2.8% | 2.5% | 2.5% |
| 9 | Italy | 160 | 192 | -16.5% | 2.4% | 2.8% |
| 10 | India | 131 | 123 | 6.5% | 1.9% | 1.8% |
| 11 | Taiwan | 86 | 113 | -23.8% | 1.3% | 1.7% |
| 12 | Netherlands | 84 | 92 | -9.2% | 1.2% | 1.4% |
| 13 | Brazil | 76 | 63 | 20.7% | 1.1% | 0.9% |
| 14 | Australia | 72 | 72 | -0.7% | 1.1% | 1.1% |
| 15 | Hong kong | 69 | 73 | -5.6% | 1.0% | 1.1% |
| 16 | Spain | 68 | 73 | -6.7% | 1.0% | 1.1% |
| 17 | Switzerland | 56 | 58 | -3.2% | 0.8% | 0.9% |
| 18 | Swedan | 54 | 59 | -8.5% | 0.8 | 0.9% |
| 19 | Singapore | 47 | 45 | 3.9% | 0.7% | 0.7% |
| 20 | South Africa | 46 | 50 | -7.9% | 0.7% | 0.7% |
| Top 20 Markets | 6165 | 6131 | 0.5% | 91.0% | 90.7% | |
| World | 6782 | 6765 | 0.3% | |||
| Source: Swiss Re Institute | ||||||
Overall, the total premium volume for the top 20 markets increased by 0.5% from 2021 to 2022, reaching USD 6,165 billion. This growth, while moderate, signifies a consistent expansion in the global insurance sector.
- The top 20 markets collectively hold a substantial portion of the global market, accounting for 91.0% of the total premiums in the insurance industry in 2022 as compared to 90.7% in 2021.
- The total global market premium volume for 2022 is recorded at USD 6,782 billion, marking a 0.3% increase from the previous year.
- The United States maintains its position as the leading insurance market, with a total premium volume of USD 2,960 billion in 2022, marking an 8.6% increase from the previous year.
- China holds the second position with a total premium volume of USD 698 billion, with a marginal 0.2% growth.
- The United Kingdom (UK), although experiencing a decline of 2.8%, stands third in the ranking, with a total premium volume of USD 363 billion.
- Japan, France, and Germany all experienced notable decreases in premium volumes, resulting in reduced global market shares compared to the previous year.
- India, with a total premium volume of USD 131 billion in 2022, experienced 6.5% growth, maintaining its position within the top 10 markets and slightly increasing its global market share to 1.9% from 1.8% in the previous year.
- Taiwan and Italy both witnessed significant decreases in their premium volumes, affecting their global market shares.
- Brazil and Canada showed growth in premium volumes, enhancing their positions in the global insurance market in 2022 as compared to the year 2021.
- The data portrays diverse market dynamics across various regions, with fluctuations reflecting both local economic conditions and industry-specific factors.
- Economic variations, regulatory changes, and consumer behaviors likely impacted the performance of individual markets.
Despite fluctuations and varying growth rates, the overall increase in the combined premium volume for the top 20 markets indicates the industry’s resilience and continued growth. The data underscores the significance of the US as the largest insurance market while also highlighting the influence of emerging markets like China and India on the global insurance landscape. It also emphasizes the competitive nature of the global insurance industry, with market shares constantly shifting due to multiple domestic and global factors.
Non-Life and Life Insurance Sector Trend
According to the Swiss Re Institute, the non-life business is anticipated to witness enhanced profitability, facilitated by better investments and a reduction in inflation, which will gradually alleviate the impact of claims severity. Projections suggest that the return on equity (ROE) for the non-life sector is expected to increase to 7.8% in 2023 from the previous year’s 3.4% and further to 9.3% by 2024. While the cost of capital is on the rise in line with improved investment returns, it is anticipated that the disparity in profitability will diminish.
The life insurance sector’s profitability appears promising, hinged on four primary factors: improved investment returns, the normalization of claims associated with COVID-19, a reduction in risk from pension and annuity premiums, and stabilized earnings volatility facilitated by the adoption of the IFRS 7 accounting framework this year. In emerging markets, a 4.3% growth in savings premiums is anticipated, with emerging Asia exhibiting the most significant growth. Forecasts suggest that the proportion of risk-based operations within the global life insurance industry will stabilize at 23% by 2028, marking an increase from 22.3% in 2022. Global risk premiums are estimated to grow by 1.7% in 2023, a figure below the long-term trend of 4.2% (CAGR 2011–21). The insurance business is gradually slowing in Western Europe and North America, reflecting the fading awareness of pandemic-related risks.
Insurance Penetration and Density
Insurance penetration and density are essential metrics used to assess the level of insurance coverage within a specific region or country. They provide insights into how well individuals and businesses are protected against various risks.
Insurance penetration measures the percentage of the population or the economy that is covered by insurance policies. It is a ratio of the total insurance premiums (in a given period) to the gross domestic product (GDP) or the total population of a country.
Insurance Penetration (%) = (Total Insurance Premiums / GDP or Population) x 100
A higher insurance penetration percentage indicates that a larger proportion of the population or the economy is covered by insurance, suggesting a higher level of insurance awareness and adoption. A lower percentage indicates a lower level of insurance coverage.
Insurance density, also known as per capita premium, measures the average premium paid per person in a given country. It represents the average spending on insurance by each individual, or the insured value per capita.
Insurance Density (USD) = Total Insurance Premiums / Total Population
Higher insurance density values indicate that, on average, individuals spend more on insurance products. This implies that people in that region have a greater willingness to invest in insurance to mitigate risks. Lower density values suggest that, on average, people spend less on insurance, indicating potentially lower awareness or affordability challenges.
| INSURANCE PENETRATION AND DENSITY BY REGION IN 2021 | ||||||
| Region | Penetration% | Density (USD) | ||||
| Life | Non-Life | Total | Life | Non-Life | Total | |
| USA & Canada | 2.7 | 8.7 | 11.4 | 1823 | 5960 | 7782 |
| Advanced EMEA | 4.8 | 3.2 | 8.0 | 2226 | 1468 | 3694 |
| Emerging EMEA | 0.6 | 1.0 | 1.6 | 35 | 58 | 92 |
| Advanced Asia-Pacific | 6.0 | 3.0 | 9.0 | 2325 | 1187 | 3512 |
| Emerging Asia-Pacific | 2.1 | 1.6 | 3.7 | 132 | 100 | 232 |
| India | 3.2 | 1.0 | 4.2 | 69 | 22 | 91 |
| World | 3.0 | 3.9 | 7 | 382 | 492 | 874 |
| Source: Swiss Re Institute | ||||||
The USA and Canada exhibit relatively high insurance penetration, with a total penetration rate of 11.4%. Both life and non-life insurance have significant penetration, with 2.7% and 8.7%, respectively.
The USA and Canada region also have the highest insurance density, with a total per capita insurance expenditure of USD 7,782. Both life and non-life insurance contribute significantly, with USD 1,823 and USD 5,960, respectively.
The Advanced Europe-Middle East-Africa (Advanced EMEA) region has moderate insurance penetration, with a total penetration rate of 8.0%. Life insurance has a higher penetration rate at 4.8% compared to non-life insurance at 3.2%.
The advanced EMEA region exhibits an insurance density of USD 3,694 per capita. Life insurance density is higher at USD 2,226, while non-life insurance is USD 1,468.
Emerging regions in Europe-Middle East-Africa (Emerging EMEA) have relatively lower insurance penetration, with a total penetration rate of 1.6%. Both life and non-life insurance have limited penetration, at 0.6% and 1.0%, respectively.
Emerging regions in Europe, the Middle East, and Africa have a lower insurance density, with a USD 92 per capita. Life insurance is at USD 35, and non-life insurance is at USD 58.
The advanced Asia-Pacific region demonstrates a substantial insurance penetration of 9.0%. Life insurance has a higher penetration rate at 6.0% compared to non-life insurance at 3.0%.
The advanced Asia-Pacific region displays an insurance density of USD 3,512 per capita. Life insurance contributes USD 2,325, and non-life insurance is USD 1,187.
The Emerging Asia-Pacific region has a moderate level of insurance penetration, with a total rate of 3.7%. Life insurance penetration is higher at 2.1%, while non-life insurance has a penetration of 1.6%.
Emerging Asia-Pacific regions have a lower insurance density of USD 232 per capita. Life insurance density is USD 132, while non-life insurance is USD 100.
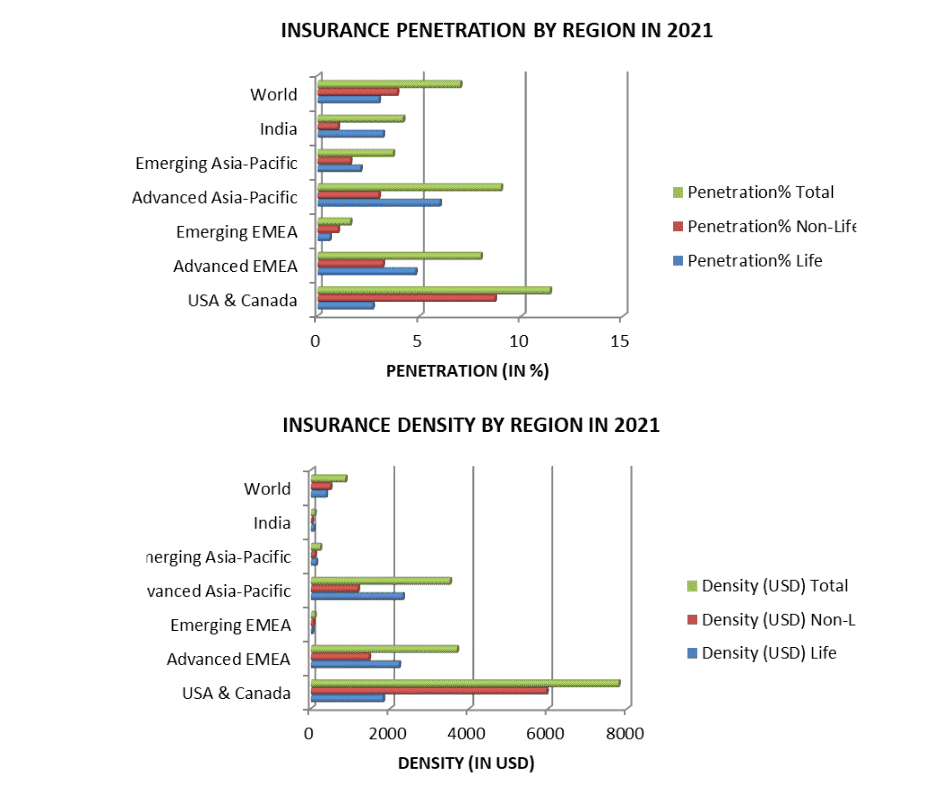
India’s insurance penetration stands at 4.2%, with life insurance penetration at 3.2% and non-life insurance at 1.0%. India’s insurance density is USD 91 per capita, with life insurance density at USD 69 and non-life insurance density at USD 22.
Globally, the average insurance penetration is 7.0%, with life insurance contributing 3.0% and non-life insurance contributing 3.9%. At the global level, the average insurance density is USD 874 per capita, with USD 382 from life insurance and USD 492 from non-life insurance.
Insurance Penetration and Density in India
| INSURANCE PENETRATION AND DENSITY IN INDIA | ||||||
| Year | Penetration (%) | Density (USD) | ||||
| Life | Non-Life | Total | Life | Non-Life | Total | |
| 2001-02 | 2.15 | 0.56 | 2.71 | 9.1 | 2.4 | 11.5 |
| 2002-03 | 2.59 | 0.67 | 3.26 | 11.7 | 3.0 | 14.7 |
| 2003-04 | 2.26 | 0.62 | 2.88 | 12.9 | 3.5 | 16.4 |
| 2004-05 | 2.53 | 0.64 | 3.17 | 15.7 | 4.0 | 19.7 |
| 2005-06 | 2.53 | 0.61 | 3.14 | 18.3 | 4.4 | 22.7 |
| 2006-07 | 4.10 | 0.60 | 4.8 | 33.2 | 5.2 | 38.4 |
| 2007-08 | 4.0 | 0.60 | 4.7 | 40.4 | 6.2 | 46.6 |
| 2008-09 | 4.0 | 0.60 | 4.6 | 41.2 | 6.2 | 47.4 |
| 2009-10 | 4.60 | 0.60 | 5.2 | 47.7 | 6.7 | 54.3 |
| 2010-11 | 4.40 | 0.71 | 5.1 | 55.7 | 8.7 | 64.4 |
| 2011-12 | 3.40 | 0.70 | 4.1 | 49.0 | 10 | 59.0 |
| 2012-13 | 3.17 | 0.78 | 3.96 | 42.7 | 10.5 | 53.2 |
| 2013-14 | 3.1 | 0.80 | 3.90 | 41.0 | 11.0 | 52.0 |
| 2014-15 | 2.6 | 0.70 | 3.30 | 44.0 | 11.0 | 55.0 |
| 2015-16 | 2.72 | 0.72 | 3.44 | 43.2 | 11.5 | 54.7 |
| 2016-17 | 2.72 | 0.77 | 3.49 | 46.5 | 13.2 | 59.7 |
| 2017-18 | 2.76 | 0.93 | 3.69 | 55 | 18 | 73 |
| 2018-19 | 2.74 | 0.97 | 3.7 | 54 | 19 | 74 |
| 2019-20 | 2.82 | 0.94 | 3.76 | 58 | 19 | 78 |
| 2020-21 | 3.2 | 1.0 | 4.2 | 59 | 19 | 78 |
| 2021-22 | 3.2 | 1.0 | 4.2 | 69 | 22 | 91 |
| Source: Swiss Re Institute, SIGMA | ||||||
In the fiscal year 2021–22, insurance penetration in India stood at 4.2 percent, maintaining parity with the figures observed in 2020–21. Over the initial decade following the liberalization of the insurance sector, there was a notable surge in insurance penetration, escalating from 2.71 percent in 2001–02 to a peak of 5.2 percent in 2009–10. Subsequently, there was a decline in insurance penetration levels until 2014–15, largely attributed to a decrease in life insurance penetration. However, from 2015–16 onwards, a resurgence in insurance penetration was observed, culminating in a rate of 4.20 percent in 2021–22. Within this context, the life insurance sector witnessed an increment in penetration, progressing from 2.15 percent in 2001–02 to 3.2 percent in 2021–22, while the non-life insurance sector saw an increase from 0.56 percent to 1.0 percent during the same period.
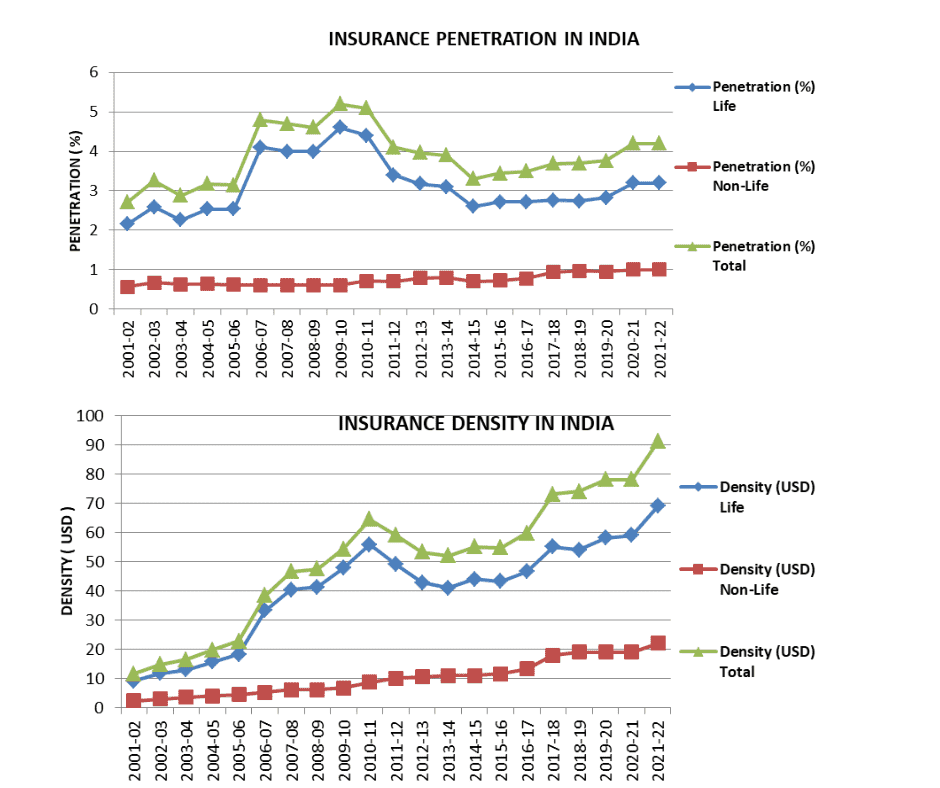
Insurance density in India saw an uptick, rising from USD 78 in 2020–21 to USD 91 in 2021–22. This metric has demonstrated a consistent upward trend, advancing from USD 11.5 in 2001–02 to USD 64.4 in 2010–11. Despite intermittent fluctuations, insurance density has maintained an overall growth trajectory since 2016–17. Notably, life insurance density has experienced a substantial increase, surging from USD 9.1 in 2001–02 to USD 69 in 2021–22, while non-life insurance density has also expanded from USD 2.4 to USD 22 during the same timeframe.
Women’s Participation in India’s Insurance Sector
The Indian insurance industry has increasingly recognized the importance of gender diversity. As a result, there has been a conscious effort to promote the inclusion of women in various roles within the sector. This shift aligns with global best practices that emphasize the benefits of a diverse workforce.
Over the years, there has been a steady increase in the number of female employees in the insurance industry. Women now occupy positions across various departments, including sales, underwriting, claims, marketing, and management. This diversity reflects a changing landscape within the sector.
Women make up approximately 49 percent of India’s total population. Their involvement in economic endeavors within the country is not only substantial but also progressively on the rise. Given these circumstances, life insurance companies must acknowledge the escalating importance of women within the national economy. There is a pressing necessity to identify any unique requirements or preferences they may have and to create tailored insurance products that offer comprehensive coverage to meet their distinct needs.
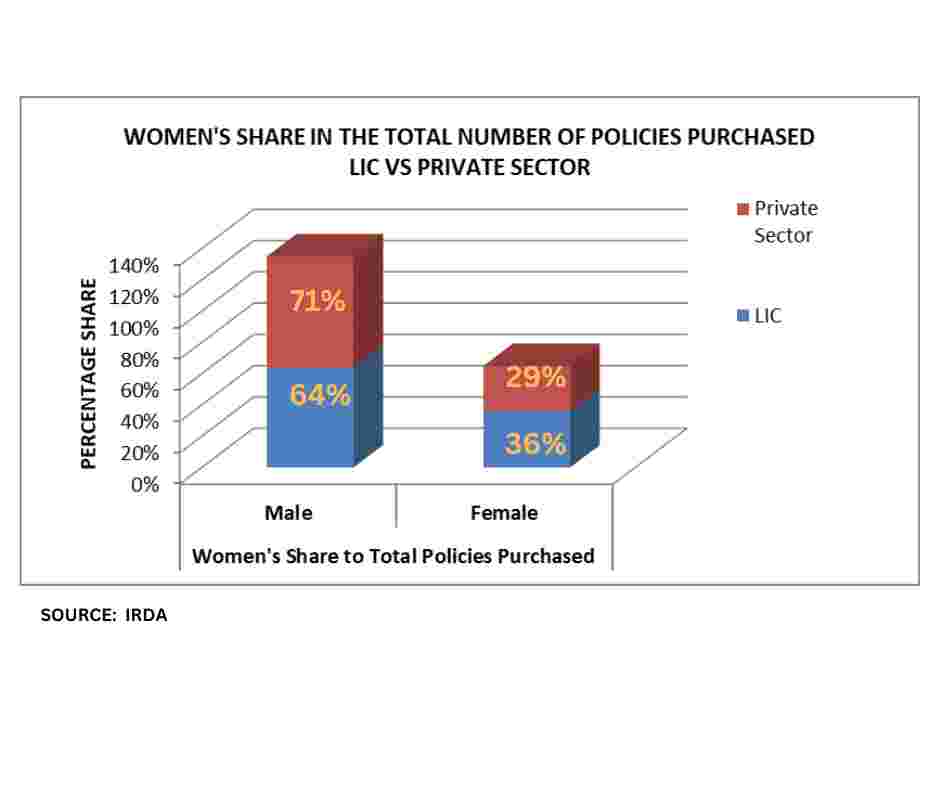
As per reports from the Insurance Regulatory and Development Authority of India (IRDA), the life insurance sector witnessed an active female workforce, with 699,429 women serving as agents. This figure constituted 29 percent of the total individual agency workforce as of March 31, 2022.
Among these women agents, 52 percent were associated with private life insurance companies, while the remaining 48 percent represented the Life Insurance Corporation of India (LIC). Notably, within the realm of private life insurers, Max Life Insurance Co. Ltd. emerged as a leader with the highest percentage of women agents, standing at 42.5 percent. It was closely followed by Ageas Federal Life Insurance Co. Ltd. at 42.4 percent and SUD Life Insurance Co. Ltd. at 41.7 percent.


